
NSIT Analysis
Fibonacci Analysis:
Fibonacci analysis evaluates the short term (30 days) intermediate term (60 days)
and long term trends (120 days) and retracements. Stocks that retrace 38.2% or less of a trend
will usually continue the trend. Retracements exceeding 61.8% indicate a reversal. Alerts
will include ABC's up/down (multiple 38% retracements) and various reversal signals.
| Time Frame | Trend | 38.2% | 50% | 61.8% |
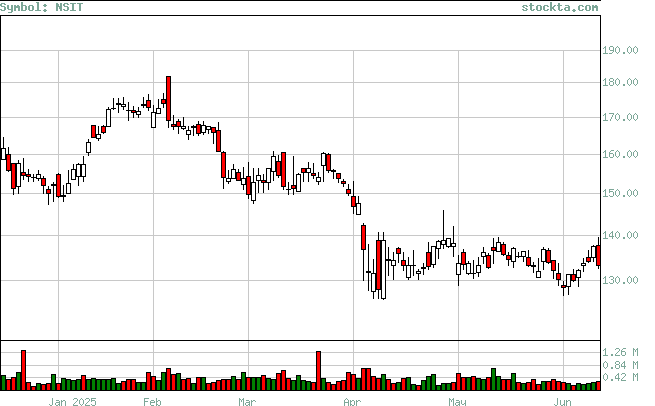
| Long | 181.92 to 126.34 | 141.8 (27.82%) | . | . |
| Intermediate | 139.32 to 128.66 | . | . | 141.8 (123.26%) |
| Short | 128.66 to 137.81 | . | . | 131.05 (73.88%) |