NSIT Analysis
High Analysis:
Evaluates if the stock is reaching new highs, and if so if there is volume to support the moves.
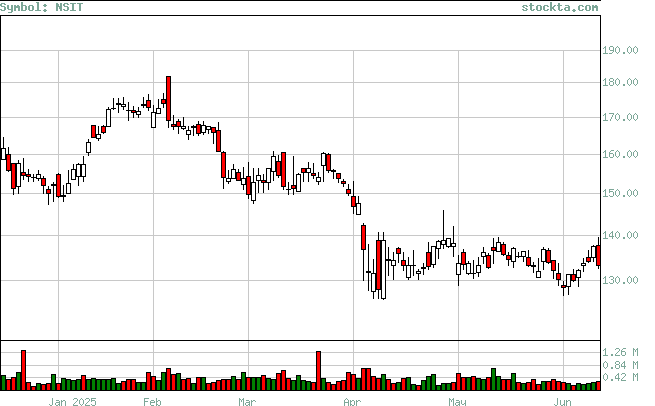
| High | Volume | Date | Volume Broken | Date Broken |
| 139.32 | 224,100 | Apr-29-2025 | 0 | Not Broken |
| 160.42 | 375,830 | Mar-24-2025 | 0 | Not Broken |
| 160.47 | 656,605 | Mar-12-2025 | 0 | Not Broken |
| 181.92 | 717,869 | Feb-06-2025 | 0 | Not Broken |
| 174.03 | 219,263 | Jan-23-2025 | 586,302 | Jan-31-2025 |
| 164.63 | 268,356 | Dec-11-2024 | 379,600 | Jan-15-2025 |
| 179.05 | 567,300 | Nov-06-2024 | 717,869 | Feb-06-2025 |